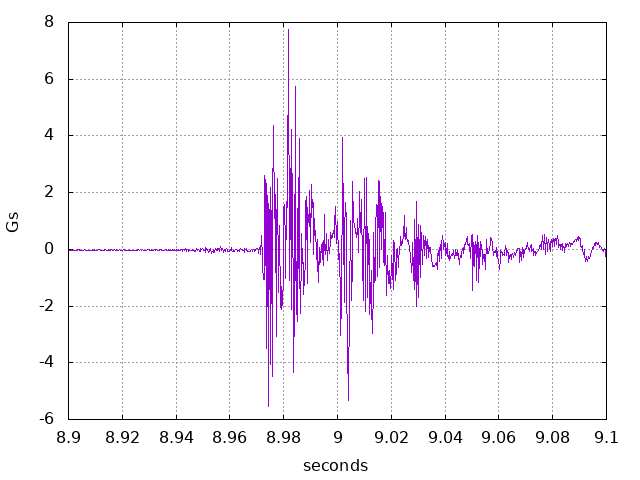
Altimeters usually have sample rates far too low to see anything interesting during ejection. A spike lasting a few samples is typical. But because ejection is (typically) the result of a pyrotechnic shock, there is more to be seen.
Pyro shock is known for having lots of high frequency energy and being omni-directional. It couples easily into all structures which is why everything responds and in all directions. While a BP charge doesn't have quite the high frequency content of a real explosive, it does have some.
The configuration for this flight was an Aerotech Initiator flying on a G64. It was stretched with an additional tube section to hold the electronics. Note that Aerotech uses a short baffle section filled with stainless steel mesh to cool the ejection gases. A MPU-9250 was configured for 4KSPS which provides bandwidth (claimed, anyway) of 1.13KHz.
The sensor was glued to the Teensy board which was mounted using PCB pins to a plywood board which had centering rings on either end. This slid into the body tube. Not the best coupling to the structure but still the shock made its way in.
First a look at the longitudinal axis.

What the MPU-9250 gives with its high sample rate it takes away with a limited range as the data exceeds the 16G range and clips. The time where the nose section of the rocket is being pushed by the ejection charge is about 30ms but the ringing continues a bit longer. Because the data is clipped you can't see all the detail of the shock response. But shock goes everywhere so the two lateral axis should see it nicely.
X axis:
Z axis:
4KSPS really isn't high enough to capture everything even with the relatively limited high frequency content of a BP charge. One detail that you have to worry about is exciting the internal resonance of the sensor. While the data sheet tells us the frequency of the gyro resonance, that information is missing for the accelerometer.
A 10KHz bandwidth (along with a better low pass filter) and 100KSPS would be a lot better.
I used the FreeSRS code to process the lateral axis data. Unfortunately FreeSRS has an annoying limitation. The frequency must be much smaller than the sample rate. I found that for frequencies greater than fs/10 the results became very large, infinite, or Not A Number. To work around this, I interpolated the data to increase the sample rate. Then processed.
X axis:
Z axis:
The interesting thing here is that the data maintains an upward slope to 1KHz which matches the bandwidth of the sensor. It is possible, even likely, that it would keep increasing if the sensor were up to the task of measuring pyro shock.
I did not calculate a shock response for the Y axis because the data there was clipped rendering it useless. But if you add the X or Z response to that for a half sine matching the Y data, you will get pretty close. The peak in that response is related to the width of the half sine. A 30ms width results in a peak at about 33Hz.
The parachute opening and even motor ignition have their own shock spectrum.
Home