
A recent post on Rocketry Planet about a high altitude flight at XPRS tweaked my interest. I requested a copy of the data file recorded by the on board RDAS and the rocket owner Terry Leright kindly provided it. What follows is a discussion of what I did and learned while playing with the data.
First of all, the latest version of the RDAS, the Tiny, is a big improvement over the previous version. Where the RDAS Compact was plagued with excessive noise in the accelerometer and pressure data, the Tiny has almost none. Which is good and bad. The bad is that a little bit of noise helps to extend the precision of the sensors which can be used to advantage by a Kalman filter.
The most notable thing about this flight is that it exceeded the range of the pressure sensor. Resulting in the usual flat line once that happened. In digging into this I learned a few things. The first is that AED has switched pressure sensors and their documention does not reflect this. The addenda for the Tiny simply says that it is a Motorola sensor with a range of 20 to 105 kPa. This is consistent with the MPX4100 sensor used on the RDAS Compact. (Which is the model I own.)
But the sensitivity figure used is 4.5mV/mBar rather than the 5.4mV/mBar typical of the MPX4100 sensor. A quick check of several FreeScale sensors shows that this sensitivity is typical of parts that have a range of 15 to 115kPa. This is once again good and bad news. The good is that the maximum usable altitude is increased. The bad is that the resolution is slightly worse.
While exhanging emails with Terry I discovered that his altimeter does not match the picture on the AED web site. The pressure sensor has changed. The most obvious sign of this change is the package appears much smaller. The actual part number can not be read so that remains a mystery.
Because I wanted to try and extrapolate the data beyond the range of the pressure sensor so I could estimate the apogee altitude, the first step was to check the sensor calibrations. This is made more difficult by the very low noise.
The usual method of calibrating the accelerometer is to capture some data while holding the altimeter steady for several seconds in first the normal upright and then inverted positions. This provides data for the +1G and -1G orientations. The data for each orientation is then averaged. This is very important as the nominal resolution is 0.1G which is not adequate for the purposes of extrapolation. But with a little bit of random noise a much higher resolution is possible using an average.
Lacking a bench calibration I was forced to use what was available from the flight data which was limited. The two seconds of pre-launch data provided the +1G data point. This was dissapointing because only a very few samples differed from 507 counts. The average is: (508*12 + 506*3 + 507*385)/400 = 507.02
A -1G value was impossible to get so I used the next best and available reference. Just prior to apogee the accelerometer will read very nearly zero G. The only deviation from zero will be the result of drag. Since the velocity is nearing a minimum this will be very low. It helps that this rocket went very high so that air density is very low as well which makes the drag nearly non-existant. I used data from between 65 and 67 seconds to get: (516*2 + 514*29 + 515*369)/400 = 514.93.
The difference between these two gives the sensitivity of the sensor: 7.91 counts/G. This is not much different from the nominal 38mV/G listed for the sensor. (7.77 counts/G)
The accelerometer data also provides the value for the sensor offset and the 1G pre-launch value is used in the calculations. This completes the accelerometer calibration.
Full pressure sensor calibration is not possible without a vaccuum chamber and calibrated pressure measurement. But even though calibration of the sensitivity isn't possible, offset is. The offset can be calibrated by using records of the local pressure at the time of launch. There is usually a weather station somewhere nearby. In this case the Weather Underground lists a station in nearby Gerlach, NV. The historical data shows that the local pressure recorded nearest to the time of launch was 29.92 inches. A quick conversion yields the more usuable value of 101.3 kPa. This is not the actual pressure at Gerlach as it has been adjusted to a sea level reference. I don't know the actual correction used and how it adjusts for temperature so the best that I can do is apply the equation for the standard atmosphere along with the known altitude of 3908 feet at the launch point:
$$ 101.3kPa * \left( {\frac {15.04-0.00649*3908ft/3.2808+ 273.1} {288.08}}\right) ^{5.256} $$
Using that result along with the equation for a line it is simple to compute the offset. This value is 9.479 kPa which is nearly identical to the nominal value for MPX6115 sensors of 9.5kPa. This is much better performance than the older 4100 series sensors so perhaps checking the calibration is no longer as big of a concern.
The data sheet for the MPX6115 on the other hand gives conflicting information on the sensitivity. It claims a sensitivity of 45.9mV/kPa but the line above shows a nominal full scale span of 4.5V. Which when you apply the full scale range of 100 kPa gives a sensitivity of 45mV/kPa. An equation later in the document in Figure 4 also uses the 45mV/kPa value. So I will stick with the 45mV/kPa value.
The usual method of conversion is to use some equation which is based on the standard atmosphere model. Some equations are better than others. I have compared the NASA equation (see link above) to a standard atmosphere table and it fits it very well. But the atmosphere is rarely standard. So something I wanted to try out here was using data available from balloon soundings. These soundings are taken twice a day at various locations. As luck would have it there are two stations pretty close to Black Rock: Reno and Elko Nevada. I used the Reno numbers. The sounding data is in the form of pressure and altitude table. Using these values it is a simple procedure to interpolate between them. (Note: I recently discovered that the altitude reported in the sounding data is a different kind of altitude. One of these days I may add the required conversion from geopotential height to geometric height. Heck, I might even switch to logarithmic interpolation.)
In order to process the data I created a program that would take as input the raw exported data from the RDAS GUI and output yet another file with the mangled data. This program is not excessivly user friendly as the calibration data is hard coded into it. So it must be recompiled for each set of data. Not a big problem for me and it seems the easiest thing to do. The program also accepts an optional file of sounding data. This file should be just the data table with none of the extraineous text before and after it so you will have to capture and edit the sounding data output. You don't need to delete the extra columns of data as they are ignored.
To illustrate the differences, here is a plot showing altitude for each of three methods: the values given by the RDAS GUI, the NASA equations, and sounding data.

It is pretty obvious that this was not a standard day. I decided to use the section of flight data that shows the end of the pressure sensor range to illustrate a couple of points. The first is that the alitude hits a limit where it flat lines. This is the result of the sensor element's integrated electronics not being able get below its voltage rails. It gets pretty close but obviously can't go below zero Volts. The second is that even before the sensor hits that limit it loses linearity. In other words changes in pressure result in less and less change in the output voltage. Obviously the sensor will never provide data indicating a higher than actual altitude.
Now that the data has been mangled as well as possible, it is time to try and estimate the altitude at apogee. One technique is to simply integrate the acceleration data twice. This has problems. The first is that any errors in sensor offset or sensitivity will result in errors in the altitude that grow as the square of time. Errors can get out of hand in a hurry. Even if you can avoid those errors, there is the problem of flights that are less than perfectly straight up. The integration must assume a simple one dimensional model of motion and simply subracts the value of gravity (1G) from the data. This is a problem when the vehicle is not aligned with vertical. So I want to try something similar, but slightly different.
My favorite tool for mangling altimeter data is the Kalman filter. (Of which there is much more elsewhere on this site.) This combines the altitude and acceleration measurements with a model of vehicle motion to estimate altitude, velocity, and acceleration. I modified the usual code to do a couple of new things.
The first is a test to see if the pressure reading is out of range. This is a simple hard coded value (recompilation required again to change it). When the estimated altitude is above this value, the pressure altitude measurement is ignored. When this happens the code essentially reverts to just integrating the acceleration measurement. The advantage over the usual method is that many of the usual errors have been removed by the pressure altitude data. At the point where the pressure sensor runs out, these errors are greatly reduced. The result is that the final apogee altitude should be more accurate.
Selecting the altitude at which to declare the pressure reading out of range is basically an art. You don't want to use too low of an altitude because you will lose the advantage of using the extra data. But if you pick too high of an altitude you will run into the region where the sensor is losing linearity and this will reduce the final apogee value. So examine the data and adjust.
One possible complication is the effect of transonic or supersonic flow on the pressure reading. The supersonic shock wave does result in pressure variations that will corrupt the pressure data. This effect isn't very obvious in this data set but it is still a problem. It may or may not have altered the pressure readings on this flight in the crucial region just below the limit.
The other thing that I did is to add a test. Normally at apogee the code would switch from using both the accelerometer and altitude data to just using the altitude data. This is a problem because the pressure sensor is reading a much lower altitude. So I reset the estimated altitude to the pressure sensor reading and also reset velocity and acceleration to zero. The result is a step change in altitude at apogee but a smooth transition once the pressure sensor is back in range. As an alternative it wouldn't be too hard to examine the data and calculate a velocity value that would fill the gap.
The final result using the sounding data:
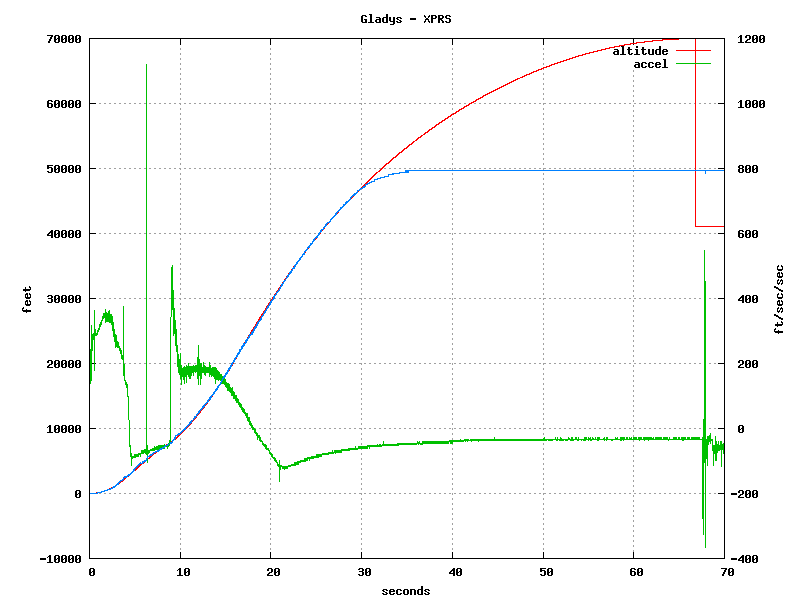
I also included the pressure altitude and acceleration data for reference. Apogee was at 73,948 feet MSL or about 70,000 feet AGL.
And finally a plot showing the descent and the change in descent rate with altitude and when the main is deployed: